Individual Site Interactive Plots
Period of Record Data
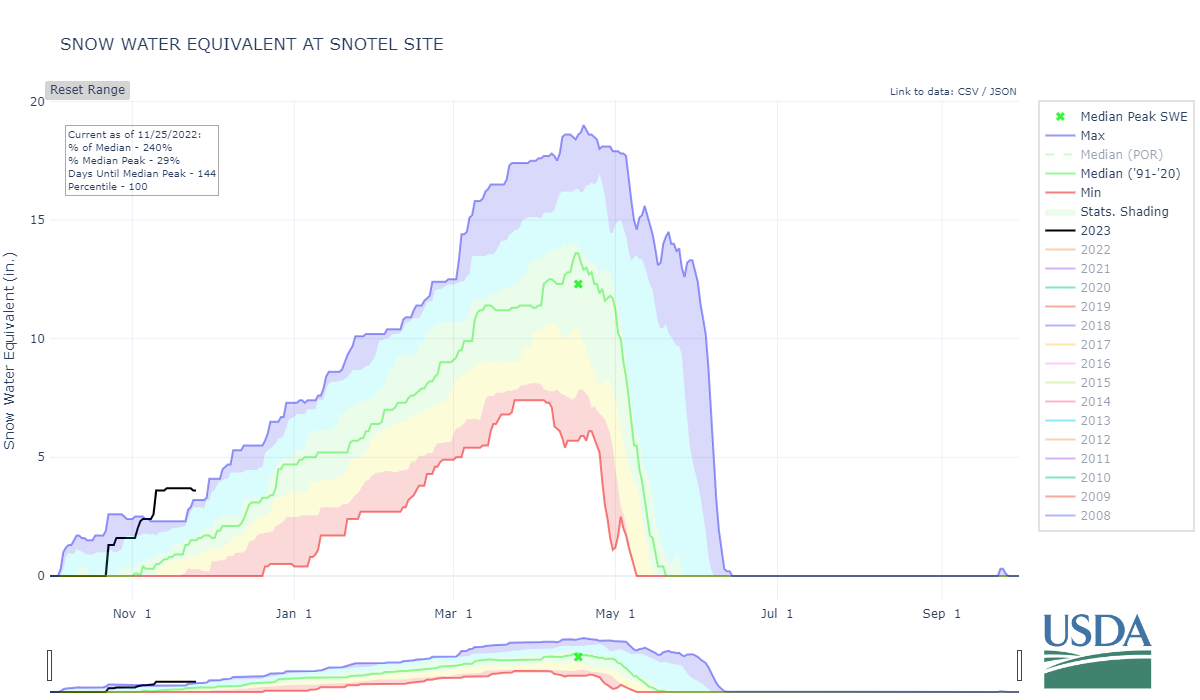
Period of record data displayed in water year format (Oct-Sept).
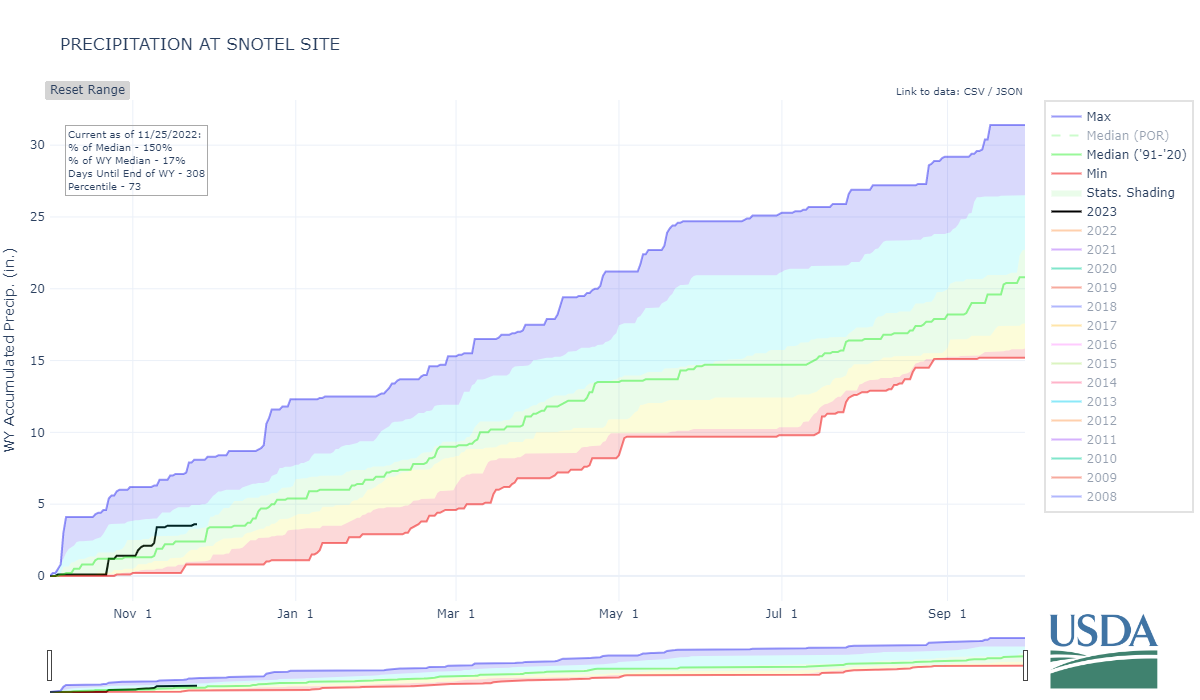
Period of record data displayed in water year format (Oct-Sept).
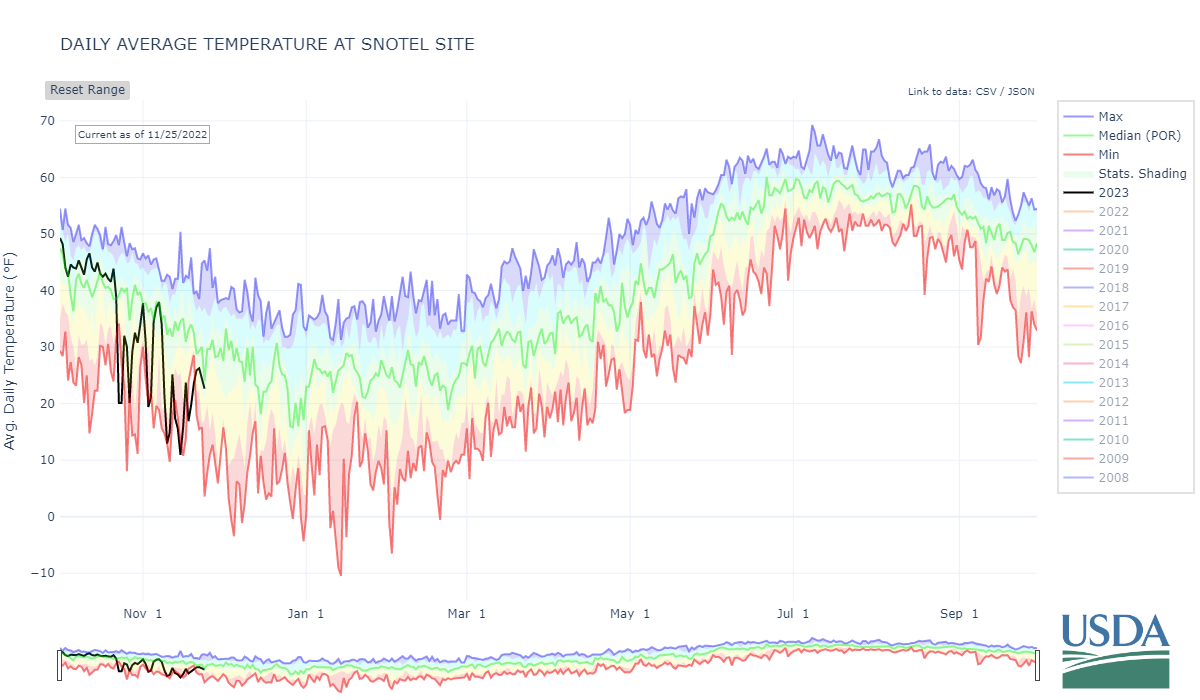
Period of record data displayed in water year format (Oct-Sept).
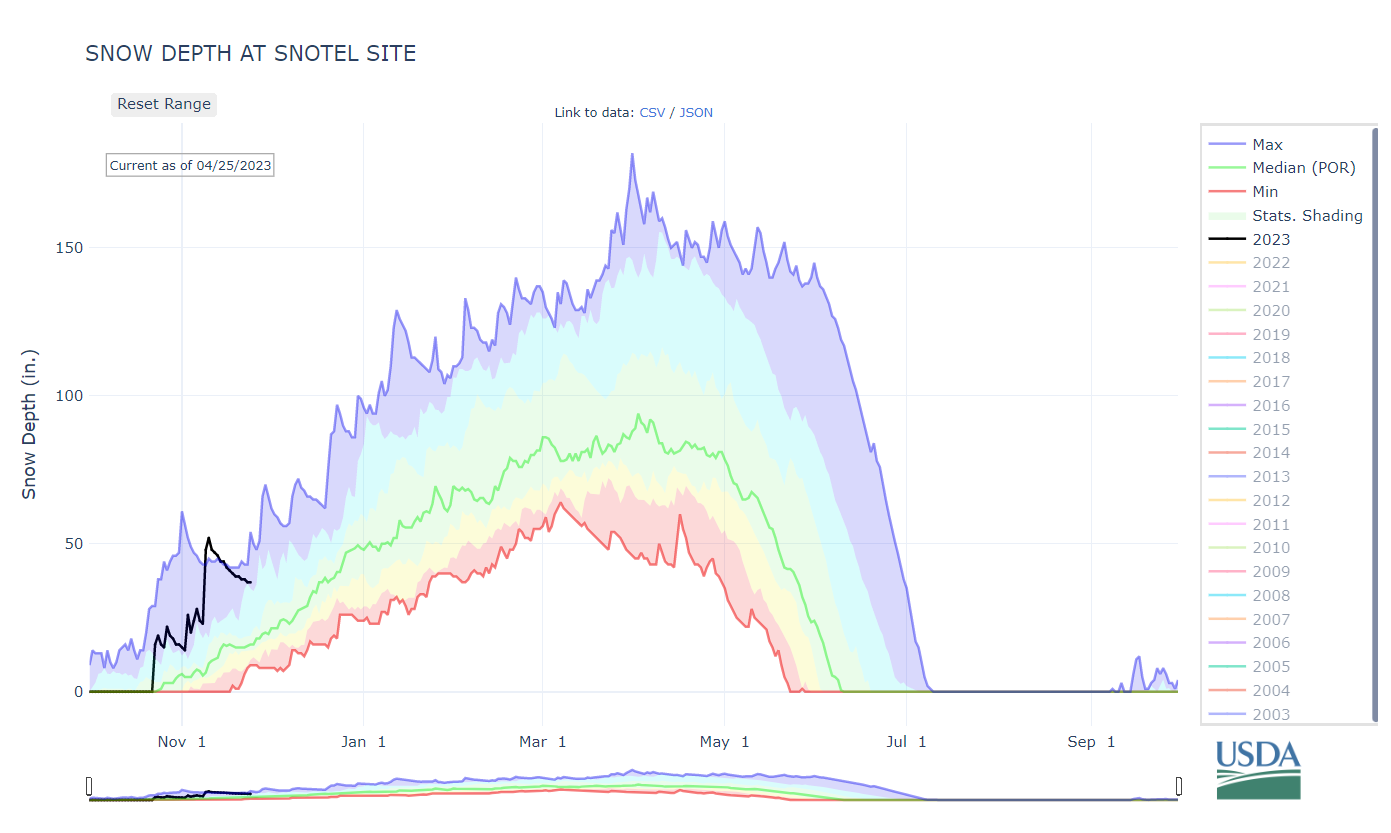
Period of record data displayed in water year format (Oct-Sept).
Water Year Projection Data
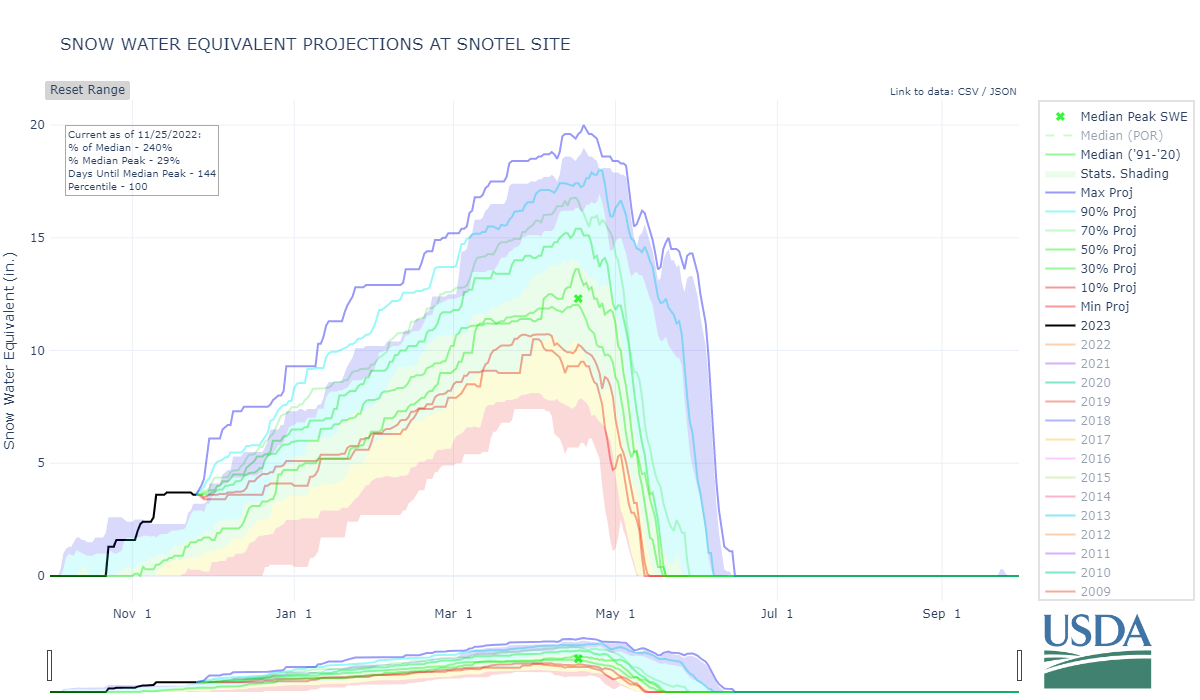
Period of record data displayed in water year format (Oct-Sept).
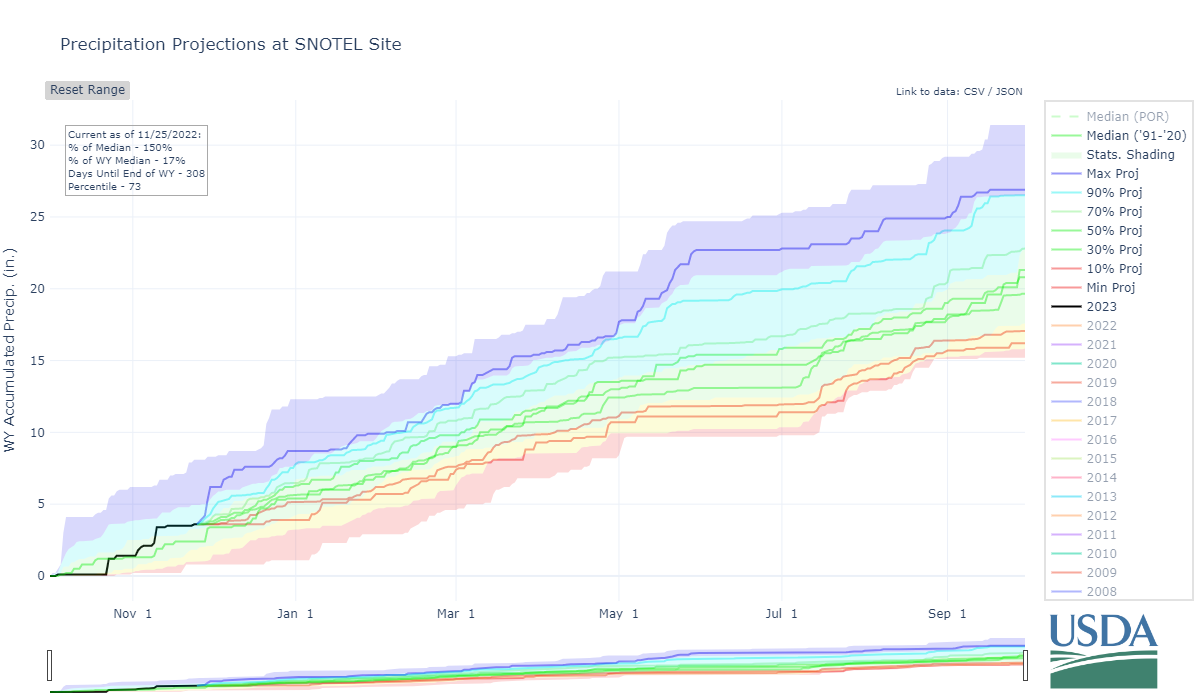
Period of record data displayed in water year format (Oct-Sept).
Forecasted Streamflow Sites
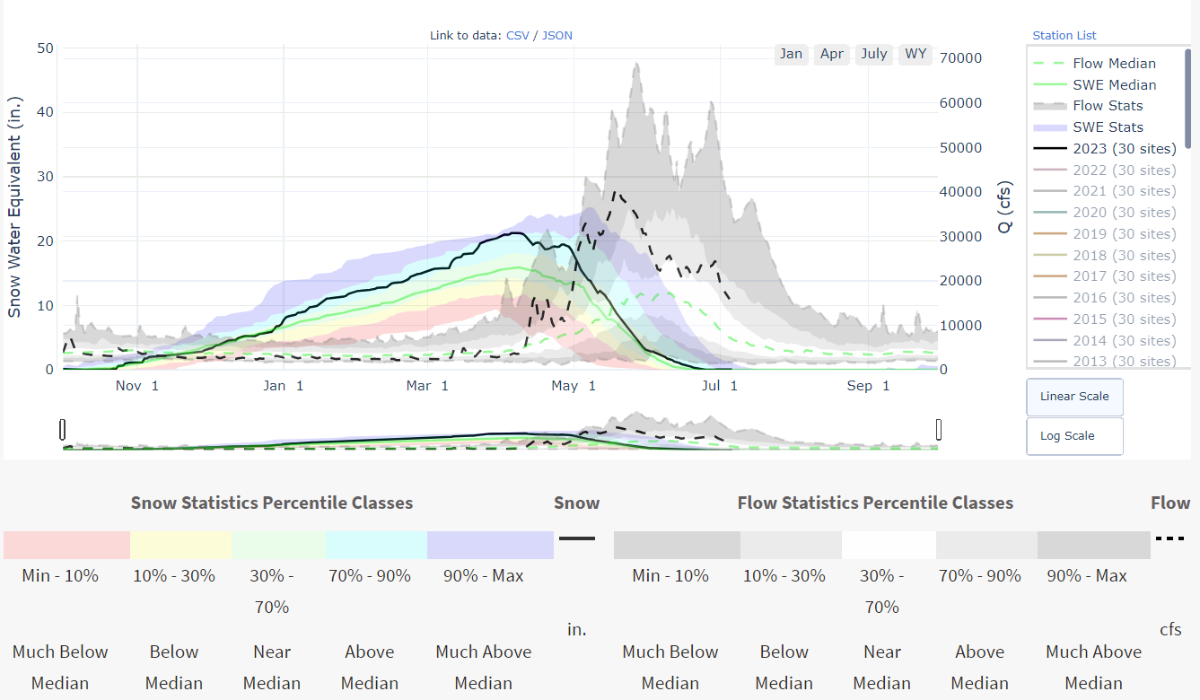
Period of record data displayed in water year format (Oct-Sept).